 wehub-resource-sync
9194ef5abd
wehub-resource-sync
9194ef5abd
Docs/Test Workflow / Test docs build (push) Failing after 0s
Check links & references / links-check (push) Failing after 1s
Pytest/Test Workflow / Import Test and Pytest Run (ubuntu-latest, 3.10) (push) Failing after 0s
Pytest/Test Workflow / Import Test and Pytest Run (ubuntu-latest, 3.11) (push) Failing after 0s
PR Conflict Labeler / main (push) Failing after 2s
Pytest/Test Workflow / Import Test and Pytest Run (ubuntu-latest, 3.12) (push) Failing after 2s
Pytest/Test Workflow / Import Test and Pytest Run (ubuntu-latest, 3.13) (push) Failing after 0s
Pytest/Test Workflow / Build this Package (push) Failing after 5s
Pytest/Test Workflow / Import Test and Pytest Run (macos-latest, 3.10) (push) Has been cancelled
Pytest/Test Workflow / Import Test and Pytest Run (macos-latest, 3.11) (push) Has been cancelled
Pytest/Test Workflow / Import Test and Pytest Run (macos-latest, 3.12) (push) Has been cancelled
Pytest/Test Workflow / Import Test and Pytest Run (macos-latest, 3.13) (push) Has been cancelled
Pytest/Test Workflow / Import Test and Pytest Run (windows-latest, 3.10) (push) Has been cancelled
Pytest/Test Workflow / Import Test and Pytest Run (windows-latest, 3.11) (push) Has been cancelled
Pytest/Test Workflow / Import Test and Pytest Run (windows-latest, 3.12) (push) Has been cancelled
Pytest/Test Workflow / Import Test and Pytest Run (windows-latest, 3.13) (push) Has been cancelled
Pytest/Test Workflow / testing-guardian (push) Has been cancelled
479 lines
20 KiB
Markdown
479 lines
20 KiB
Markdown
---
|
||
comments: true
|
||
description: Benchmark object detection models with supervision — compute mAP, confusion matrix, and per-class metrics to compare model performance.
|
||
authors:
|
||
- name: Piotr Skalski
|
||
role: Computer Vision Engineer, Roboflow
|
||
github: https://github.com/SkalskiP
|
||
date_modified: 2026-04-22
|
||
---
|
||
|
||
|
||
|
||
# Benchmark a Model
|
||
|
||
Have you ever trained multiple detection models and wondered which one performs best on your specific use case? Or maybe you've downloaded a pre-trained model and want to verify its performance on your dataset? Model benchmarking is essential for making informed decisions about which model to deploy in production.
|
||
|
||
This guide will show an easy way to benchmark your results using `supervision`. It will go over:
|
||
|
||
1. [Loading a dataset](#loading-a-dataset)
|
||
2. [Loading a model](#loading-a-model)
|
||
3. [Benchmarking Basics](#benchmarking-basics)
|
||
4. [Running a Model](#running-a-model)
|
||
5. [Remapping Classes](#remapping-classes)
|
||
6. [Visual Benchmarking](#visual-benchmarking)
|
||
7. [Benchmarking Metrics](#benchmarking-metrics)
|
||
8. [Mean Average Precision (mAP)](#mean-average-precision-map)
|
||
9. [F1 Score](#f1-score)
|
||
10. [Bonus: Model Leaderboard](#model-leaderboard)
|
||
|
||
This guide will use an instance segmentation model, but it applies to object detection, instance segmentation, and oriented bounding box models (OBB) too.
|
||
|
||
A condensed version of this guide is available as a [Colab Notebook](https://colab.research.google.com/drive/1HoOY9pZoVwGiRMmLHtir0qT6Uj45w6Ps?usp=sharing).
|
||
|
||
## Loading a Dataset
|
||
|
||
Suppose you start with a dataset. Perhaps you found it on [Universe](https://universe.roboflow.com/); perhaps you [labeled your own](https://roboflow.com/how-to-label/yolo11). In either case, this guide assumes you know of a labelled dataset at hand.
|
||
|
||
We'll use the following libraries:
|
||
|
||
- `roboflow` to manage the dataset and deploy models
|
||
- `inference` to run the models
|
||
- `supervision` to evaluate the model results
|
||
|
||
```bash
|
||
pip install roboflow inference "supervision[metrics]"
|
||
```
|
||
|
||
Here's how you can download a dataset:
|
||
|
||
```python
|
||
from roboflow import Roboflow
|
||
|
||
rf = Roboflow(api_key="<YOUR_API_KEY>")
|
||
project = rf.workspace("<WORKSPACE_NAME>").project("<PROJECT_NAME>")
|
||
dataset = project.version("<DATASET_VERSION_NUMBER>").download("<FORMAT>")
|
||
```
|
||
|
||
If your dataset is from Universe, go to `Dataset` > `Download Dataset` > select the format (e.g. `YOLOv11`) > `Show download code`.
|
||
|
||
If labeling your own data, go to the [dashboard](https://app.roboflow.com/) and check this [guide](https://docs.roboflow.com/api-reference/workspace-and-project-ids) to find your workspace and project IDs.
|
||
|
||
In this guide, we shall use a small [Corgi v2](https://universe.roboflow.com/model-examples/segmented-animals-basic) dataset. It is well-labeled and comes with a test set.
|
||
|
||
```python
|
||
from roboflow import Roboflow
|
||
|
||
rf = Roboflow(api_key="<YOUR_API_KEY>")
|
||
project = rf.workspace("fbamse1-gm2os").project("corgi-v2")
|
||
dataset = project.version(4).download("yolov11")
|
||
```
|
||
|
||
This will create a folder called `Corgi-v2-4` with the dataset in the current working directory, with `train`, `test`, and `valid` folders and a `data.yaml` file.
|
||
|
||
## Loading a Model
|
||
|
||
Let's load a model.
|
||
|
||
Select and instantiate the detection or segmentation model you want to benchmark. Supervision works with Roboflow Inference for both local and cloud-deployed models, as well as Ultralytics YOLO checkpoints. Choose the tab below that matches your preferred framework, then pass images to the loaded model during the evaluation loop.
|
||
|
||
=== "Inference, Local"
|
||
|
||
Roboflow supports a range of state-of-the-art [pre-trained models](https://inference.roboflow.com/quickstart/aliases/) for object detection, instance segmentation, and pose tracking. You don't even need an API key!
|
||
|
||
Let's load such a model with inference [`inference`](https://inference.roboflow.com/).
|
||
|
||
```python
|
||
from inference import get_model
|
||
|
||
model = get_model(model_id="yolov11s-seg-640")
|
||
```
|
||
|
||
=== "Inference, Deployed"
|
||
|
||
You can train and deploy a model without leaving the Roboflow platform. See this [guide](https://docs.roboflow.com/train/train/train-from-scratch) for more details.
|
||
|
||
To load a model, you can use inference:
|
||
|
||
```python
|
||
from inference import get_model
|
||
|
||
model_id = "<PROJECT_NAME>/<MODEL_VERSION>"
|
||
model = get_model(model_id=model_id)
|
||
```
|
||
|
||
=== "Ultralytics"
|
||
|
||
Similarly to Inference, Ultralytics allows you to run a variety of models.
|
||
|
||
```bash
|
||
pip install "ultralytics<=8.3.40"
|
||
```
|
||
|
||
```python
|
||
from ultralytics import YOLO
|
||
|
||
model = YOLO("yolo11s-seg.pt")
|
||
```
|
||
|
||
## Benchmarking Basics
|
||
|
||
Evaluating your model requires careful selection of the dataset. Which images should you use?Let's go over the different scenarios.
|
||
|
||
- **Unrelated Dataset**: If you have a dataset that was not used to train the model, this is the best choice.
|
||
- **Training Set**: This is the set of images used to train the model. This is fine if the model was not trained on this dataset. Otherwise, **never** use it for benchmarking - the results will seem unrealistically good.
|
||
- **Validation Set**: This is the set of images used to validate the model during training. Every Nth training epoch, the model is evaluated on the validation set. Often the training is stopped once the validation loss stops improving. Therefore, even while the images aren't used to train the model, it still indirectly influences the training outcome.
|
||
- **Test Set**: This is the set of images kept aside for model testing. It is exactly the set you should use for benchmarking. If the dataset was split correctly, none of these images would be shown to the model during training.
|
||
|
||
Therefore, an unrelated dataset or the `test` set is the best choice for benchmarking. Several other problems may arise:
|
||
|
||
- **Extra Classes**: An unrelated dataset may contain additional classes which you may need to [filter out](https://supervision.roboflow.com/how_to/filter_detections/#by-set-of-classes) before computing metrics.
|
||
- **Class Mismatch**: In an unrelated dataset, the class names or IDs may be different to what your model produces, you'll need to remap them, which is [shown in this guide](#running-a-model).
|
||
- **Data Contamination**: The `test` set may not be split correctly, with images from the test set also present in `training` or `validation` set and used during training. In this case, the results will be overly optimistic. This also applies when **very similar** images are used for training and testing - e.g. those taken in the same environment, same lighting conditions, similar angle, etc.
|
||
- **Missing Test Set**: Some datasets do not come with a test set. In this case, you should collect and [label](https://roboflow.com/annotate) your own data. Alternatively, a validation set could be used, but the results could be overly optimistic. Make sure to test in the real world as soon as possible.
|
||
|
||
## Running a Model
|
||
|
||
At this stage, you should have:
|
||
|
||
- A dataset of labeled images to evaluate the model.
|
||
- A model prepared for benchmarking.
|
||
|
||
With these ready, we can now run the model and obtain predictions. We'll use `supervision` to create a dataset iterator, and then run the model on each image.
|
||
|
||
=== "Inference"
|
||
|
||
```python
|
||
import supervision as sv
|
||
|
||
test_set = sv.DetectionDataset.from_yolo(
|
||
images_directory_path=f"{dataset.location}/test/images",
|
||
annotations_directory_path=f"{dataset.location}/test/labels",
|
||
data_yaml_path=f"{dataset.location}/data.yaml",
|
||
)
|
||
|
||
image_paths = []
|
||
predictions_list = []
|
||
targets_list = []
|
||
|
||
for image_path, image, label in test_set:
|
||
result = model.infer(image)[0]
|
||
predictions = sv.Detections.from_inference(result)
|
||
|
||
image_paths.append(image_path)
|
||
predictions_list.append(predictions)
|
||
targets_list.append(label)
|
||
```
|
||
|
||
=== "Ultralytics"
|
||
|
||
```python
|
||
import supervision as sv
|
||
|
||
test_set = sv.DetectionDataset.from_yolo(
|
||
images_directory_path=f"{dataset.location}/test/images",
|
||
annotations_directory_path=f"{dataset.location}/test/labels",
|
||
data_yaml_path=f"{dataset.location}/data.yaml",
|
||
)
|
||
|
||
image_paths = []
|
||
predictions_list = []
|
||
targets_list = []
|
||
|
||
for image_path, image, label in test_set:
|
||
result = model(image)[0]
|
||
predictions = sv.Detections.from_ultralytics(result)
|
||
|
||
image_paths.append(image_path)
|
||
predictions_list.append(predictions)
|
||
targets_list.append(label)
|
||
```
|
||
|
||
## Remapping classes
|
||
|
||
Did you notice an issue in the above logic? Since we're using an unrelated dataset, the class names and IDs may be different from what the model was trained on.
|
||
|
||
We need to remap them to match the dataset classes. Here's how to do it:
|
||
|
||
```python
|
||
def remap_classes(
|
||
detections: sv.Detections,
|
||
class_ids_from_to: dict[int, int],
|
||
class_names_from_to: dict[str, str],
|
||
) -> None:
|
||
new_class_ids = [
|
||
class_ids_from_to.get(class_id, class_id) for class_id in detections.class_id
|
||
]
|
||
detections.class_id = np.array(new_class_ids)
|
||
|
||
new_class_names = [
|
||
class_names_from_to.get(name, name) for name in detections["class_name"]
|
||
]
|
||
predictions["class_name"] = np.array(new_class_names)
|
||
```
|
||
|
||
Let's also remove the predictions that are not in the dataset classes.
|
||
|
||
=== "Inference"
|
||
|
||
Dataset class names and IDs can be found in the `data.yaml` file, or by printing `dataset.classes`.
|
||
|
||
```python
|
||
import supervision as sv
|
||
|
||
test_set = sv.DetectionDataset.from_yolo(
|
||
images_directory_path=f"{dataset.location}/test/images",
|
||
annotations_directory_path=f"{dataset.location}/test/labels",
|
||
data_yaml_path=f"{dataset.location}/data.yaml",
|
||
)
|
||
|
||
image_paths = []
|
||
predictions_list = []
|
||
targets_list = []
|
||
|
||
for image_path, image, label in test_set:
|
||
result = model.infer(image)[0]
|
||
predictions = sv.Detections.from_inference(result)
|
||
|
||
remap_classes(
|
||
detections=predictions,
|
||
class_ids_from_to={16: 0},
|
||
class_names_from_to={"dog": "Corgi"},
|
||
)
|
||
predictions = predictions[np.isin(predictions["class_name"], test_set.classes),]
|
||
|
||
image_paths.append(image_path)
|
||
predictions_list.append(predictions)
|
||
targets_list.append(label)
|
||
```
|
||
|
||
=== "Ultralytics"
|
||
|
||
Dataset class names and IDs can be found in the `data.yaml` file, or by printing `dataset.classes`.
|
||
|
||
Each model will have a different class mapping, so make sure to check the model's documentation. In this case, the model was trained on the COCO dataset, with a class configuration found [here](https://github.com/ultralytics/ultralytics/blob/main/ultralytics/cfg/datasets/coco8.yaml).
|
||
|
||
```python
|
||
import supervision as sv
|
||
|
||
test_set = sv.DetectionDataset.from_yolo(
|
||
images_directory_path=f"{dataset.location}/test/images",
|
||
annotations_directory_path=f"{dataset.location}/test/labels",
|
||
data_yaml_path=f"{dataset.location}/data.yaml",
|
||
)
|
||
|
||
image_paths = []
|
||
predictions_list = []
|
||
targets_list = []
|
||
|
||
for image_path, image, label in test_set:
|
||
result = model(image)[0]
|
||
predictions = sv.Detections.from_ultralytics(result)
|
||
|
||
remap_classes(
|
||
detections=predictions,
|
||
class_ids_from_to={16: 0},
|
||
class_names_from_to={"dog": "Corgi"},
|
||
)
|
||
predictions = predictions[np.isin(predictions["class_name"], test_set.classes),]
|
||
|
||
image_paths.append(image_path)
|
||
predictions_list.append(predictions)
|
||
targets_list.append(label)
|
||
```
|
||
|
||
## Visualizing Predictions
|
||
|
||
The first step in evaluating your model’s performance is to visualize its predictions. This gives an intuitive sense of how well your model is detecting objects and where it might be failing.
|
||
|
||
```python
|
||
import supervision as sv
|
||
|
||
N = 9
|
||
GRID_SIZE = (3, 3)
|
||
|
||
target_annotator = sv.PolygonAnnotator(color=sv.Color.from_hex("#8315f9"), thickness=8)
|
||
prediction_annotator = sv.PolygonAnnotator(
|
||
color=sv.Color.from_hex("#00cfc6"), thickness=6
|
||
)
|
||
|
||
|
||
annotated_images = []
|
||
for image_path, predictions, targets in zip(
|
||
image_paths[:N], predictions_list[:N], targets_list[:N]
|
||
):
|
||
annotated_image = cv2.imread(image_path)
|
||
annotated_image = target_annotator.annotate(
|
||
scene=annotated_image, detections=targets
|
||
)
|
||
annotated_image = prediction_annotator.annotate(
|
||
scene=annotated_image, detections=prediction
|
||
)
|
||
annotated_images.append(annotated_image)
|
||
|
||
sv.plot_images_grid(images=annotated_images, grid_size=GRID_SIZE)
|
||
```
|
||
|
||
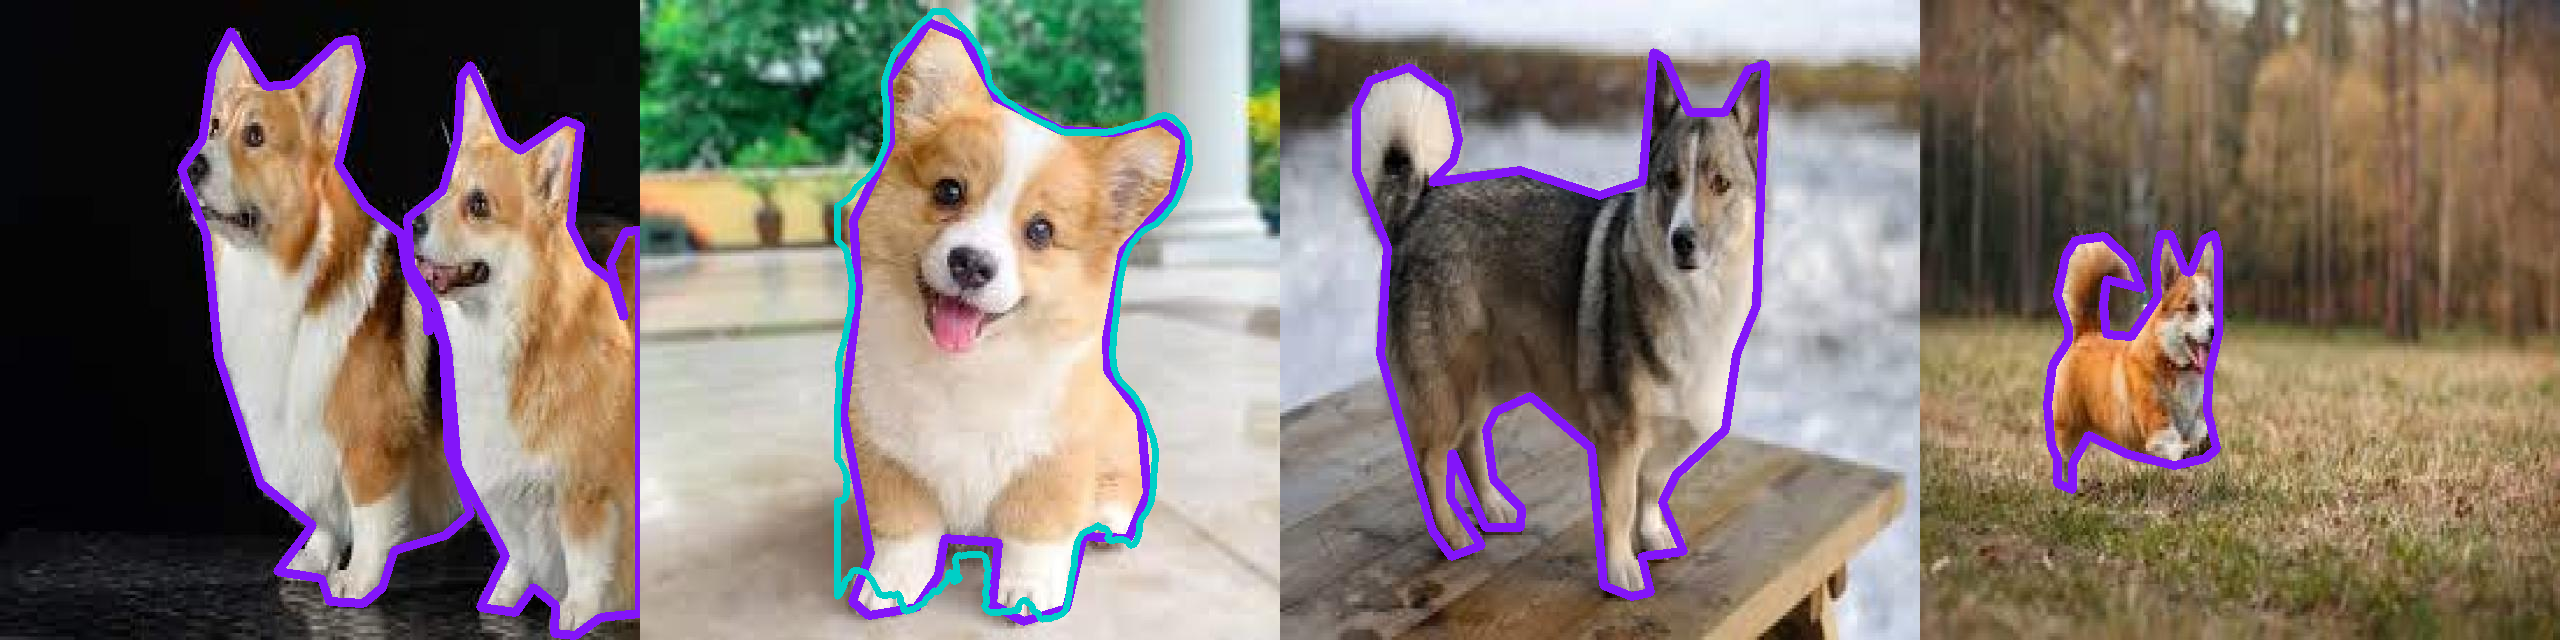
Here, predictions in purple are targets (ground truth), and predictions in teal are model predictions.
|
||
|
||
|
||
|
||
!!! tip
|
||
|
||
Use `sv.BoxAnnotator` for object detection and `sv.OrientedBoxAnnotator` for OBB.
|
||
|
||
See [annotator documentation](https://supervision.roboflow.com/latest/detection/annotators/) for even more options.
|
||
|
||
## Visual Benchmarking
|
||
|
||
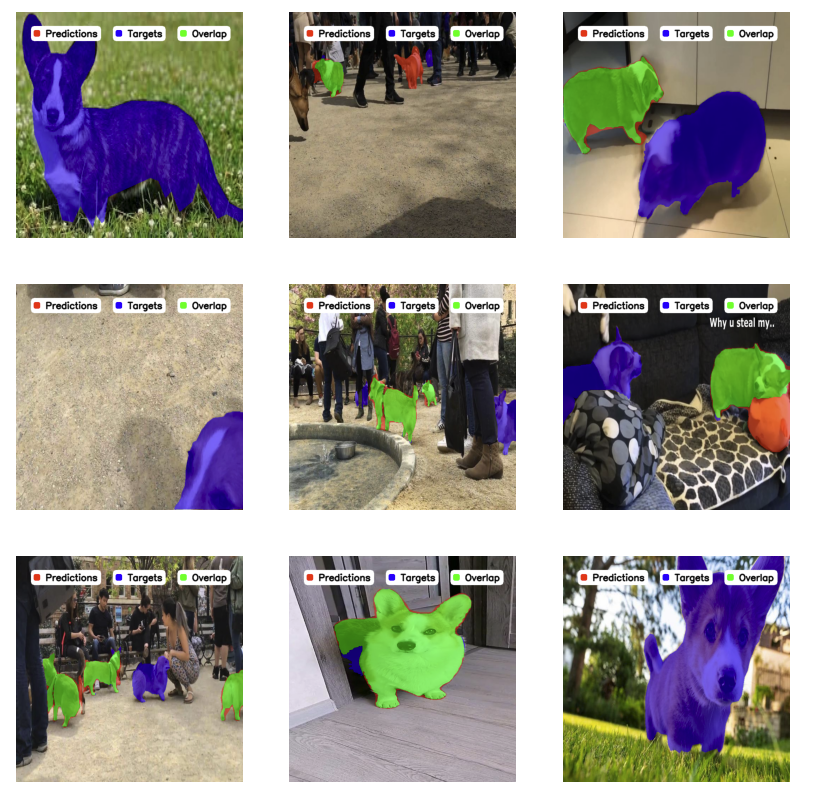
To inspect where a model succeeds and fails, pass `save_directory_path` to `sv.ConfusionMatrix.benchmark(...)`. For every dataset image it writes a 2x2 result grid — `Ground Truth`, `True Positives`, `False Positives`, and `False Negatives` panels — directly into that directory, reusing the original image filenames. This makes it easy to skim through per-image outcomes alongside the aggregate confusion matrix.
|
||
|
||
```python
|
||
import supervision as sv
|
||
|
||
confusion_matrix = sv.ConfusionMatrix.benchmark(
|
||
dataset=test_set,
|
||
callback=callback,
|
||
save_directory_path="./results",
|
||
)
|
||
```
|
||
|
||
## Benchmarking Metrics
|
||
|
||
With multiple models, fine details matter. Visual inspection may not be enough. `supervision` provides a collection of metrics that help obtain precise numerical results of model performance.
|
||
|
||
### Mean Average Precision (mAP)
|
||
|
||
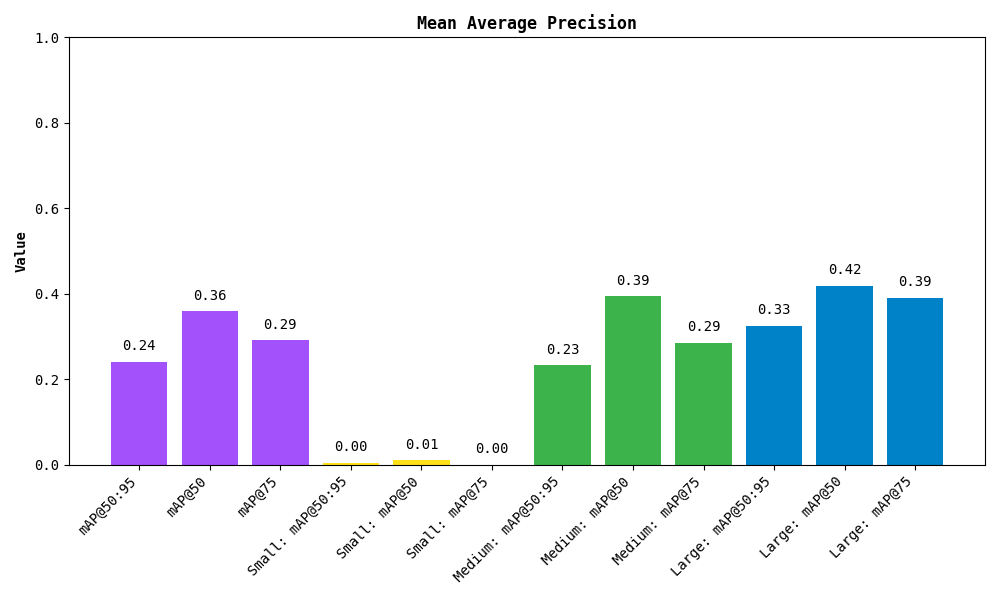
We'll start with [MeanAveragePrecision (mAP)](https://supervision.roboflow.com/latest/metrics/mean_average_precision/#supervision.metrics.mean_average_precision.MeanAveragePrecision), which is the most commonly used metric for object detection. It measures the average precision across all classes and IoU thresholds.
|
||
|
||
For a thorough explanation, check out our [blog](https://blog.roboflow.com/mean-average-precision/) and [Youtube video](https://www.youtube.com/watch?v=oqXDdxF_Wuw).
|
||
|
||
Here, the most popular value is `mAP 50:95`. It represents the average precision across all classes and IoU thresholds (`0.5` to `0.95`), whereas other values such as `mAP 50` or `mAP 75` only consider a single IoU threshold (`0.5` and `0.75` respectively).
|
||
|
||
Let's compute the mAP:
|
||
|
||
```python
|
||
from supervision.metrics import MeanAveragePrecision, MetricTarget
|
||
|
||
map_metric = MeanAveragePrecision(metric_target=MetricTarget.MASKS)
|
||
map_result = map_metric.update(predictions_list, targets_list).compute()
|
||
```
|
||
|
||
Try printing the result to see it at a glance:
|
||
|
||
```python
|
||
print(map_result)
|
||
```
|
||
|
||
```
|
||
MeanAveragePrecisionResult:
|
||
Metric target: MetricTarget.MASKS
|
||
Class agnostic: False
|
||
mAP @ 50:95: 0.2409
|
||
mAP @ 50: 0.3591
|
||
mAP @ 75: 0.2915
|
||
mAP scores: [0.35909 0.3468 0.34556 ...]
|
||
IoU thresh: [0.5 0.55 0.6 ...]
|
||
AP per class:
|
||
0: [0.35909 0.3468 0.34556 ...]
|
||
...
|
||
Small objects: ...
|
||
Medium objects: ...
|
||
Large objects: ...
|
||
```
|
||
|
||
You can also plot the results:
|
||
|
||
```python
|
||
map_result.plot()
|
||
```
|
||
|
||
|
||
|
||
The metric also breaks down the results by detected object area. Small, medium and large are simply those with area less than 32², between 32² and 96², and greater than 96² pixels respectively.
|
||
|
||
### F1 Score
|
||
|
||
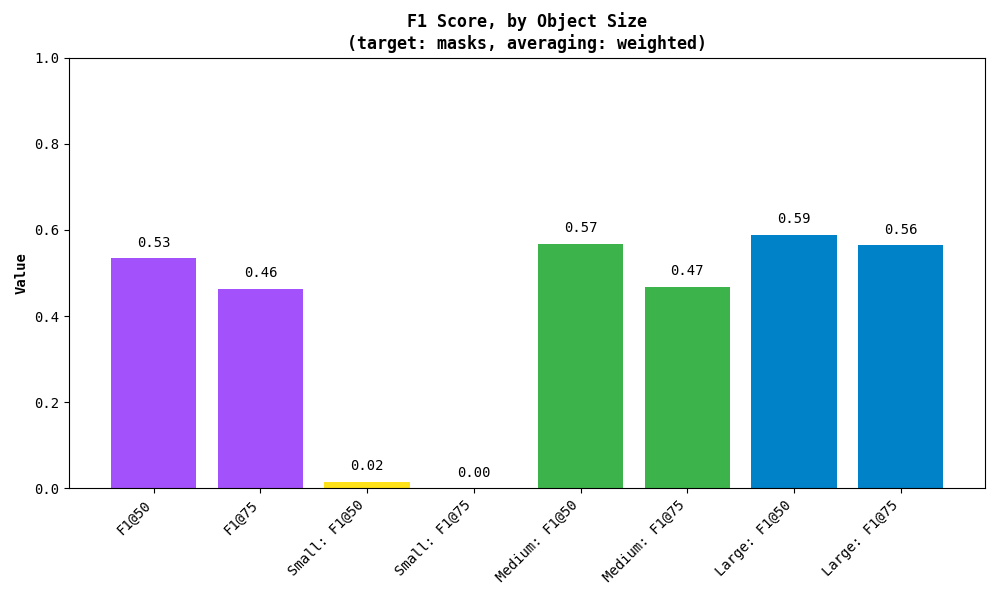
The [F1 Score](https://supervision.roboflow.com/latest/metrics/f1_score/) is another useful metric, especially when dealing with an imbalance between false positives and false negatives. It’s the harmonic mean of **precision** (how many predictions are correct) and **recall** (how many actual instances were detected).
|
||
|
||
Here's how you can compute the F1 score:
|
||
|
||
```python
|
||
from supervision.metrics import F1Score, MetricTarget
|
||
|
||
f1_metric = F1Score(metric_target=MetricTarget.MASKS)
|
||
f1_result = f1_metric.update(predictions_list, targets_list).compute()
|
||
```
|
||
|
||
As with mAP, you can also print the result:
|
||
|
||
```python
|
||
print(f1_result)
|
||
```
|
||
|
||
```
|
||
F1ScoreResult:
|
||
Metric target: MetricTarget.MASKS
|
||
Averaging method: AveragingMethod.WEIGHTED
|
||
F1 @ 50: 0.5341
|
||
F1 @ 75: 0.4636
|
||
F1 @ thresh: [0.53406 0.5278 0.52153 ...]
|
||
IoU thresh: [0.5 0.55 0.6 ...]
|
||
F1 per class:
|
||
0: [0.53406 0.5278 0.52153 ...]
|
||
...
|
||
Small objects: ...
|
||
Medium objects: ...
|
||
Large objects: ...
|
||
```
|
||
|
||
Similarly, you can plot the results:
|
||
|
||
```python
|
||
f1_result.plot()
|
||
```
|
||
|
||
|
||
|
||
As with mAP, the metric also breaks down the results by detected object area. Small, medium and large are simply those with area less than 32², between 32² and 96², and greater than 96² pixels respectively.
|
||
|
||
## Model Leaderboard
|
||
|
||
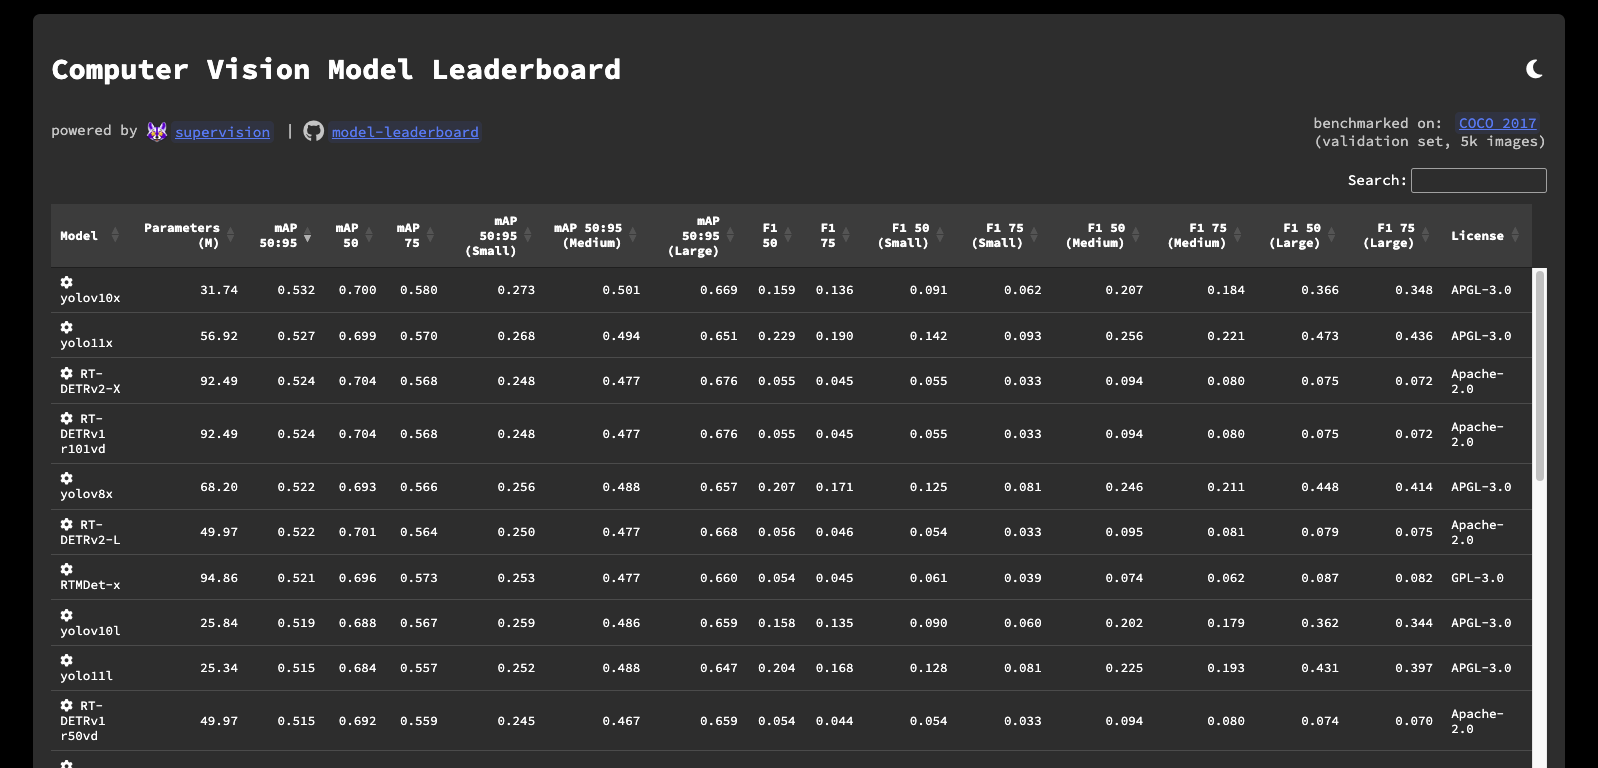
Here to compare the basic models? We've got you covered. Check out our [Model Leaderboard](https://leaderboard.roboflow.com/) to see how different models perform and to get a sense of the state-of-the-art results. It's a great place to understand what the leading models can achieve and to compare your own results.
|
||
|
||
Even better, the repository is open source! You can see how the models were benchmarked, run the evaluation yourself, and even add your own models to the leaderboard. Check it out on [GitHub](https://github.com/roboflow/model-leaderboard)!
|
||
|
||
|
||
|
||
## Conclusion
|
||
|
||
In this guide, you've learned how to set up your environment, train or use pre-trained models, visualize predictions, and evaluate model performance with metrics like [mAP](https://supervision.roboflow.com/latest/metrics/mean_average_precision/), [F1 score](https://supervision.roboflow.com/latest/metrics/f1_score/), and got to know our Model Leaderboard.
|
||
|
||
A condensed version of this guide is also available as a [Colab Notebook](https://colab.research.google.com/drive/1HoOY9pZoVwGiRMmLHtir0qT6Uj45w6Ps?usp=sharing).
|
||
|
||
For more details, be sure to check out our [documentation](https://supervision.roboflow.com/latest/) and join our community discussions. If you find any issues, please let us know on [GitHub](https://github.com/roboflow/supervision/issues).
|
||
|
||
Best of luck with your benchmarking!
|
||
|
||
## Frequently Asked Questions
|
||
|
||
### How do I benchmark a model with supervision?
|
||
|
||
Use `supervision.metrics.mean_average_precision.MeanAveragePrecision` — accumulate prediction and ground-truth `Detections` with `update(...)` and then call `compute()`. For confusion matrices, use `sv.ConfusionMatrix.from_detections(predictions=predictions, targets=targets, classes=classes)`.
|
||
|
||
### What IoU thresholds does MeanAveragePrecision use?
|
||
|
||
It computes mAP over IoU thresholds from 0.50 to 0.95 in steps of 0.05 (mAP@50:95), plus mAP@50 and mAP@75 individually.
|
||
|
||
### Can I benchmark segmentation models?
|
||
|
||
Yes, if you want to evaluate their bounding boxes. Convert model outputs to `Detections` and pass them to `MeanAveragePrecision.update(...)`; the current mAP path prepares COCO-style bounding boxes from `detections.xyxy`.
|
||
|
||
### What is a ConfusionMatrix and how do I use it?
|
||
|
||
`sv.ConfusionMatrix` visualizes true positives, false positives, and false negatives per class. Create one with `sv.ConfusionMatrix.from_detections(predictions=predictions, targets=targets, classes=classes, conf_threshold=0.5, iou_threshold=0.5)`, then call `confusion_matrix.plot()` to render a heatmap. If you want per-image validation visualizations saved to disk, pass `save_directory_path="./results"` to `sv.ConfusionMatrix.benchmark(...)`; it will write 2x2 result grids directly into that directory using the original image filenames, with `Ground Truth`, `True Positives`, `False Positives`, and `False Negatives` panels.
|
||
|
||
## Author
|
||
|
||
- [Piotr Skalski](https://github.com/SkalskiP) — Computer Vision Engineer, Roboflow
|