 wehub-resource-sync
6.5 KiB
myst
| myst | ||||
|---|---|---|---|---|
|
(ray-core-internal-profiling)=
Profiling for Ray developers
This guide helps contributors to the Ray project analyze Ray performance.
Getting a stack trace of Ray C++ processes
You can use the following GDB command to view the current stack trace of any running Ray process (for example, raylet). This can be useful for debugging 100% CPU utilization or infinite loops. Run the command a few times to see what the process is stuck on.
sudo gdb -batch -ex "thread apply all bt" -p <pid>
Note that you can find the pid of the raylet with pgrep raylet.
Installation
These instructions are for Ubuntu only. Attempts to get pprof to correctly symbolize on macOS have failed.
sudo apt-get install google-perftools libgoogle-perftools-dev
You may need to install graphviz for pprof to generate flame graphs.
sudo apt-get install graphviz
CPU profiling
To launch Ray in profiling mode and profile Raylet, define the following variables:
export PERFTOOLS_PATH=/usr/lib/x86_64-linux-gnu/libprofiler.so
export PERFTOOLS_LOGFILE=/tmp/pprof.out
export RAY_RAYLET_PERFTOOLS_PROFILER=1
The file /tmp/pprof.out is empty until you let the binary run the target workload for a while and then kill it via ray stop or by letting the driver exit.
Note: Enabling RAY_RAYLET_PERFTOOLS_PROFILER allows profiling of the Raylet component. To profile other modules, use RAY_{MODULE}_PERFTOOLS_PROFILER, where MODULE represents the uppercase form of the process type, such as GCS_SERVER.
Visualizing the CPU profile
You can visualize the output of pprof in different ways. Below, the output is a zoomable .svg image displaying the call graph annotated with hot paths.
# Use the appropriate path.
RAYLET=ray/python/ray/core/src/ray/raylet/raylet

google-pprof -svg $RAYLET /tmp/pprof.out > /tmp/pprof.svg
# Then open the .svg file with Chrome.

# If you realize the call graph is too large, use -focus=<some function> to zoom
# into subtrees.
google-pprof -focus=epoll_wait -svg $RAYLET /tmp/pprof.out > /tmp/pprof.svg
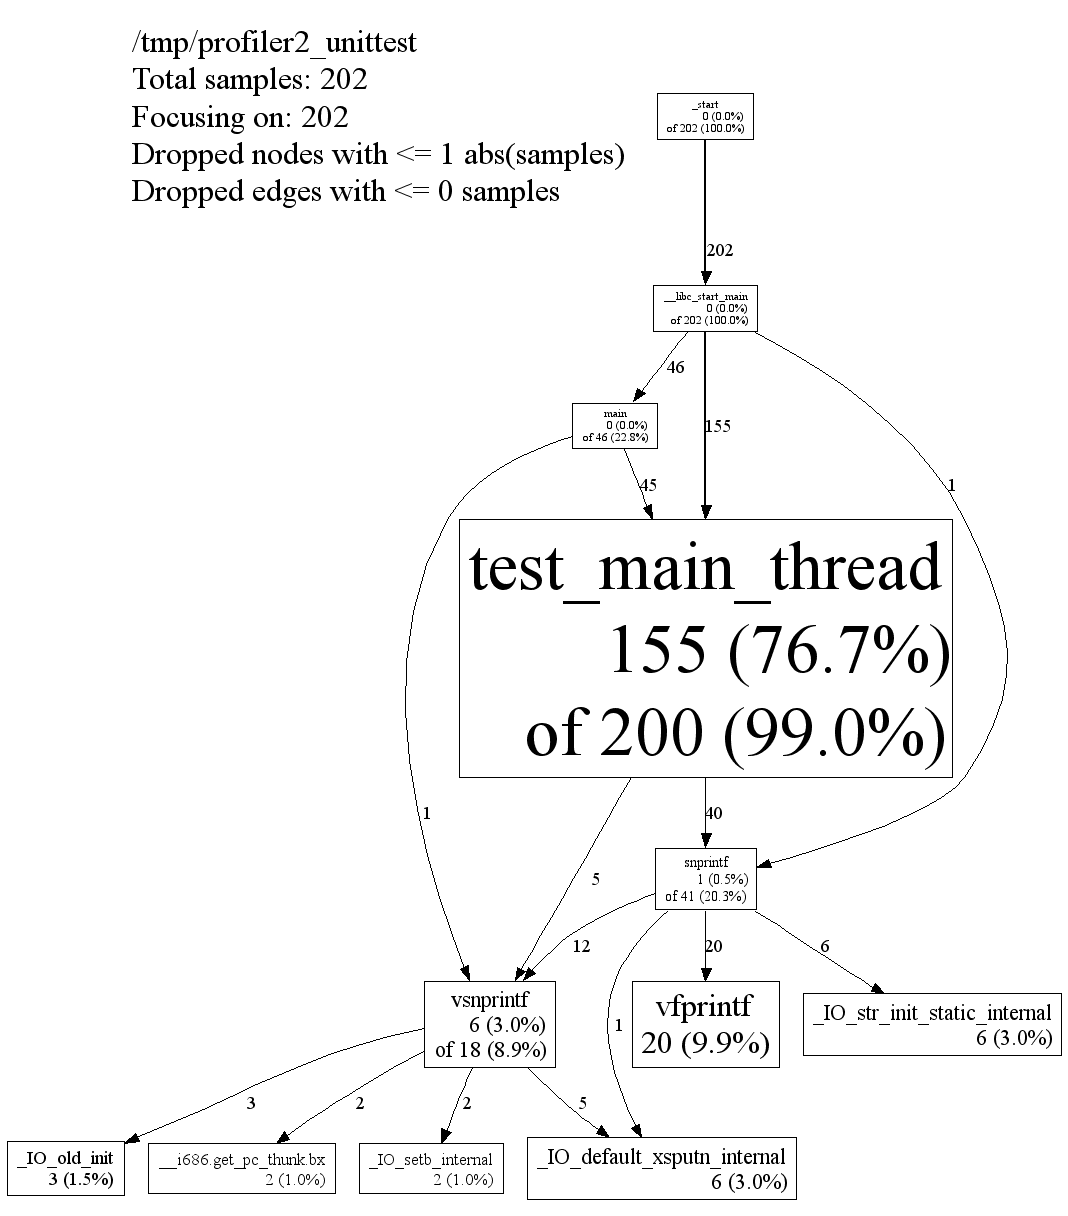
Below is a snapshot of an example SVG output, from the official documentation:
Memory profiling
To run memory profiling on Ray core components, use jemalloc. Ray supports environment variables that override LD_PRELOAD on core components.
You can find the component name from ray_constants.py. For example, if you'd like to profile gcs_server, search PROCESS_TYPE_GCS_SERVER in ray_constants.py. You can see the value is gcs_server.
You must provide four environment variables for memory profiling.
RAY_JEMALLOC_LIB_PATH: The path to the jemalloc shared librarylibjemalloc.so.RAY_JEMALLOC_CONF: The MALLOC_CONF configuration for jemalloc, using comma-separated values. Read jemalloc docs for more details.RAY_JEMALLOC_PROFILE: Comma-separated Ray components to run Jemalloc.so. For example, ("raylet,gcs_server"). Note that the components should match the process type inray_constants.py. (It means "RAYLET,GCS_SERVER" won't work).RAY_LD_PRELOAD_ON_WORKERS: Default value is0, which means Ray doesn't preload Jemalloc for workers if a library is incompatible with Jemalloc. Set to1to instruct Ray to preload Jemalloc for a worker using values configured byRAY_JEMALLOC_LIB_PATHandRAY_JEMALLOC_PROFILE.
# Install jemalloc
wget https://github.com/jemalloc/jemalloc/releases/download/5.2.1/jemalloc-5.2.1.tar.bz2
tar -xf jemalloc-5.2.1.tar.bz2
cd jemalloc-5.2.1
export JEMALLOC_DIR=$PWD
./configure --enable-prof --enable-prof-libunwind
make
sudo make install

# Verify jeprof is installed.
which jeprof

# Start a Ray head node with jemalloc enabled.
# (1) `prof_prefix` defines the path to the output profile files and the prefix of their file names.
# (2) This example only profiles the GCS server component.
RAY_JEMALLOC_CONF=prof:true,lg_prof_interval:33,lg_prof_sample:17,prof_final:true,prof_leak:true,prof_prefix:$PATH_TO_OUTPUT_DIR/jeprof.out \
RAY_JEMALLOC_LIB_PATH=$JEMALLOC_DIR/lib/libjemalloc.so \
RAY_JEMALLOC_PROFILE=gcs_server \
ray start --head

# Check the output files. You should see files with the format of "jeprof.<pid>.0.f.heap".
# Example: jeprof.out.1904189.0.f.heap
ls $PATH_TO_OUTPUT_DIR/

# If you don't see any output files, try stopping the Ray cluster to force it to flush the
# profile data since `prof_final:true` is set.
ray stop

# Use jeprof to view the profile data. The first argument is the binary of GCS server.
# Note that you can also use `--pdf` or `--svg` to generate different formats of the profile data.
jeprof --text $YOUR_RAY_SRC_DIR/python/ray/core/src/ray/gcs/gcs_server $PATH_TO_OUTPUT_DIR/jeprof.out.1904189.0.f.heap

# [Example output]
Using local file ../ray/core/src/ray/gcs/gcs_server.
Using local file jeprof.out.1904189.0.f.heap.
addr2line: DWARF error: section .debug_info is larger than its filesize! (0x93f189 vs 0x530e70)
Total: 1.0 MB
    0.3  25.9%  25.9%      0.3  25.9% absl::lts_20230802::container_internal::InitializeSlots
    0.1  12.9%  38.7%      0.1  12.9% google::protobuf::DescriptorPool::Tables::CreateFlatAlloc
    0.1  12.4%  51.1%      0.1  12.4% ::do_tcp_client_global_init
    0.1  12.3%  63.4%      0.1  12.3% grpc_core::Server::Start
    0.1  12.2%  75.6%      0.1  12.2% std::__cxx11::basic_string::_M_assign
    0.1  12.2%  87.8%      0.1  12.2% std::__cxx11::basic_string::_M_mutate
    0.1  12.2% 100.0%      0.1  12.2% std::__cxx11::basic_string::reserve
    0.0   0.0% 100.0%      0.8  75.4% EventTracker::RecordExecution
...
Running microbenchmarks
To run a set of single-node Ray microbenchmarks, use:
ray microbenchmark
You can find the microbenchmark results for Ray releases in the GitHub release logs.
References
- The pprof documentation.
- A Go version of pprof.
- The gperftools, including libprofiler, tcmalloc, and other useful tools.