---
myst:
html_meta:
description: "Profiling guide for Ray contributors, including how to capture stack traces of C++ processes with gdb and analyze Ray's performance. Read this to diagnose high CPU usage, hangs, or bottlenecks in Ray internals."
---
(ray-core-internal-profiling)=
# Profiling for Ray developers
This guide helps contributors to the Ray project analyze Ray performance.
## Getting a stack trace of Ray C++ processes
You can use the following GDB command to view the current stack trace of any running Ray process (for example, raylet). This can be useful for debugging 100% CPU utilization or infinite loops. Run the command a few times to see what the process is stuck on.
```shell
sudo gdb -batch -ex "thread apply all bt" -p
```
Note that you can find the pid of the raylet with `pgrep raylet`.
## Installation
These instructions are for Ubuntu only. Attempts to get `pprof` to correctly symbolize on macOS have failed.
```bash
sudo apt-get install google-perftools libgoogle-perftools-dev
```
You may need to install `graphviz` for `pprof` to generate flame graphs.
```bash
sudo apt-get install graphviz
```
## CPU profiling
To launch Ray in profiling mode and profile Raylet, define the following variables:
```bash
export PERFTOOLS_PATH=/usr/lib/x86_64-linux-gnu/libprofiler.so
export PERFTOOLS_LOGFILE=/tmp/pprof.out
export RAY_RAYLET_PERFTOOLS_PROFILER=1
```
The file `/tmp/pprof.out` is empty until you let the binary run the target workload for a while and then `kill` it via `ray stop` or by letting the driver exit.
Note: Enabling `RAY_RAYLET_PERFTOOLS_PROFILER` allows profiling of the Raylet component. To profile other modules, use `RAY_{MODULE}_PERFTOOLS_PROFILER`, where `MODULE` represents the uppercase form of the process type, such as `GCS_SERVER`.
### Visualizing the CPU profile
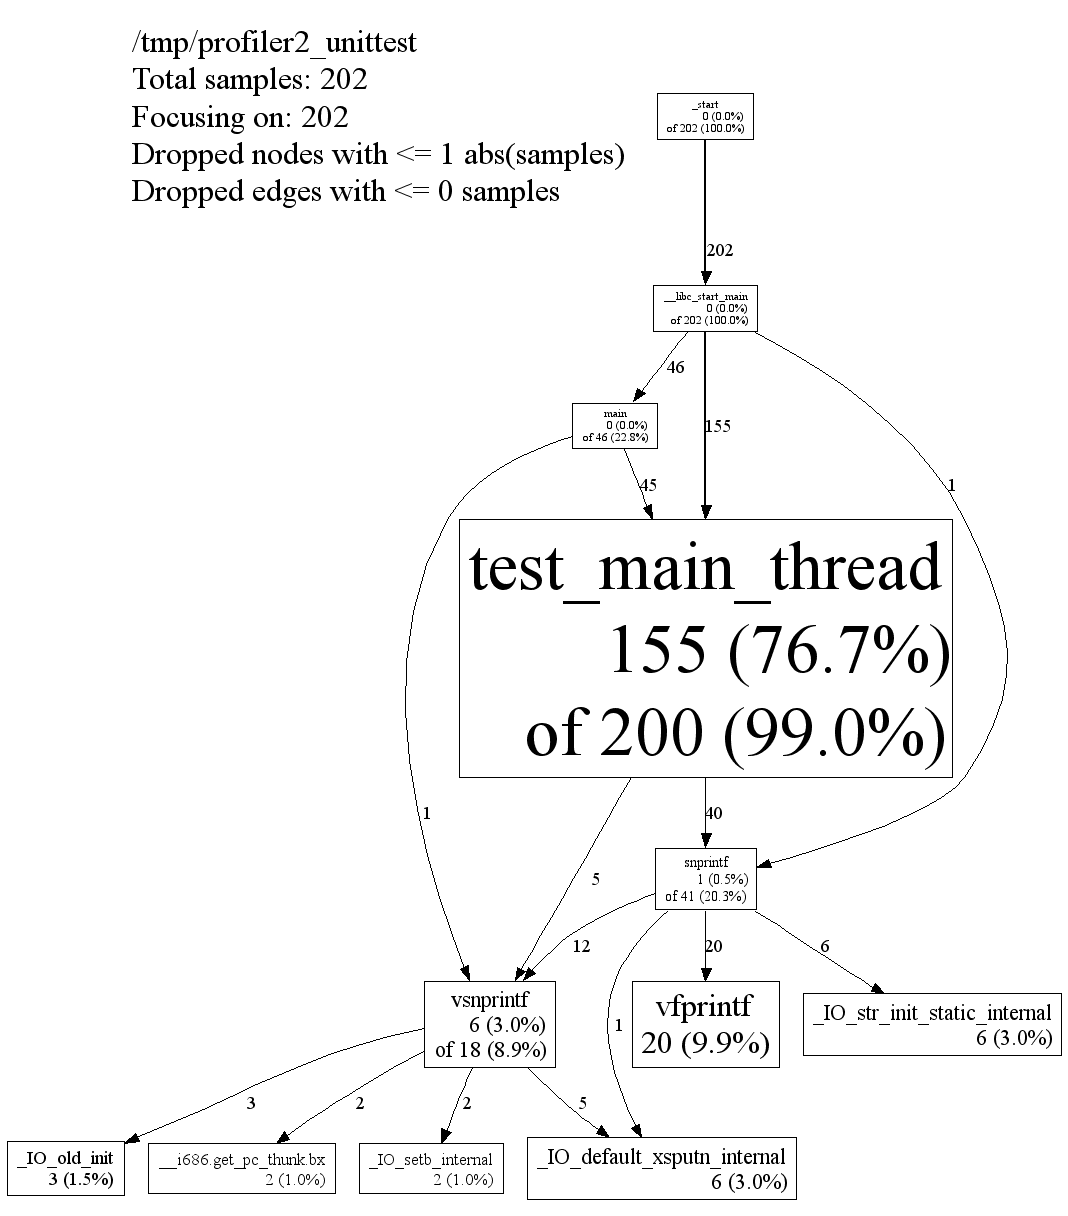
You can visualize the output of `pprof` in different ways. Below, the output is a zoomable `.svg` image displaying the call graph annotated with hot paths.
```bash
# Use the appropriate path.
RAYLET=ray/python/ray/core/src/ray/raylet/raylet
google-pprof -svg $RAYLET /tmp/pprof.out > /tmp/pprof.svg
# Then open the .svg file with Chrome.
# If you realize the call graph is too large, use -focus= to zoom
# into subtrees.
google-pprof -focus=epoll_wait -svg $RAYLET /tmp/pprof.out > /tmp/pprof.svg
```
Below is a snapshot of an example SVG output, from the official documentation:
## Memory profiling
To run memory profiling on Ray core components, use [jemalloc](https://github.com/jemalloc/jemalloc). Ray supports environment variables that override `LD_PRELOAD` on core components.
You can find the component name from `ray_constants.py`. For example, if you'd like to profile gcs_server, search `PROCESS_TYPE_GCS_SERVER` in `ray_constants.py`. You can see the value is `gcs_server`.
You must provide four environment variables for memory profiling.
* `RAY_JEMALLOC_LIB_PATH`: The path to the jemalloc shared library `libjemalloc.so`.
* `RAY_JEMALLOC_CONF`: The MALLOC_CONF configuration for jemalloc, using comma-separated values. Read [jemalloc docs](http://jemalloc.net/jemalloc.3.html) for more details.
* `RAY_JEMALLOC_PROFILE`: Comma-separated Ray components to run Jemalloc `.so`. For example, ("raylet,gcs_server"). Note that the components should match the process type in `ray_constants.py`. (It means "RAYLET,GCS_SERVER" won't work).
* `RAY_LD_PRELOAD_ON_WORKERS`: Default value is `0`, which means Ray doesn't preload Jemalloc for workers if a library is incompatible with Jemalloc. Set to `1` to instruct Ray to preload Jemalloc for a worker using values configured by `RAY_JEMALLOC_LIB_PATH` and `RAY_JEMALLOC_PROFILE`.
```bash
# Install jemalloc
wget https://github.com/jemalloc/jemalloc/releases/download/5.2.1/jemalloc-5.2.1.tar.bz2
tar -xf jemalloc-5.2.1.tar.bz2
cd jemalloc-5.2.1
export JEMALLOC_DIR=$PWD
./configure --enable-prof --enable-prof-libunwind
make
sudo make install
# Verify jeprof is installed.
which jeprof
# Start a Ray head node with jemalloc enabled.
# (1) `prof_prefix` defines the path to the output profile files and the prefix of their file names.
# (2) This example only profiles the GCS server component.
RAY_JEMALLOC_CONF=prof:true,lg_prof_interval:33,lg_prof_sample:17,prof_final:true,prof_leak:true,prof_prefix:$PATH_TO_OUTPUT_DIR/jeprof.out \
RAY_JEMALLOC_LIB_PATH=$JEMALLOC_DIR/lib/libjemalloc.so \
RAY_JEMALLOC_PROFILE=gcs_server \
ray start --head
# Check the output files. You should see files with the format of "jeprof..0.f.heap".
# Example: jeprof.out.1904189.0.f.heap
ls $PATH_TO_OUTPUT_DIR/
# If you don't see any output files, try stopping the Ray cluster to force it to flush the
# profile data since `prof_final:true` is set.
ray stop
# Use jeprof to view the profile data. The first argument is the binary of GCS server.
# Note that you can also use `--pdf` or `--svg` to generate different formats of the profile data.
jeprof --text $YOUR_RAY_SRC_DIR/python/ray/core/src/ray/gcs/gcs_server $PATH_TO_OUTPUT_DIR/jeprof.out.1904189.0.f.heap
# [Example output]
Using local file ../ray/core/src/ray/gcs/gcs_server.
Using local file jeprof.out.1904189.0.f.heap.
addr2line: DWARF error: section .debug_info is larger than its filesize! (0x93f189 vs 0x530e70)
Total: 1.0 MB
0.3 25.9% 25.9% 0.3 25.9% absl::lts_20230802::container_internal::InitializeSlots
0.1 12.9% 38.7% 0.1 12.9% google::protobuf::DescriptorPool::Tables::CreateFlatAlloc
0.1 12.4% 51.1% 0.1 12.4% ::do_tcp_client_global_init
0.1 12.3% 63.4% 0.1 12.3% grpc_core::Server::Start
0.1 12.2% 75.6% 0.1 12.2% std::__cxx11::basic_string::_M_assign
0.1 12.2% 87.8% 0.1 12.2% std::__cxx11::basic_string::_M_mutate
0.1 12.2% 100.0% 0.1 12.2% std::__cxx11::basic_string::reserve
0.0 0.0% 100.0% 0.8 75.4% EventTracker::RecordExecution
...
```
## Running microbenchmarks
To run a set of single-node Ray microbenchmarks, use:
```bash
ray microbenchmark
```
You can find the microbenchmark results for Ray releases in the [GitHub release logs](https://github.com/ray-project/ray/tree/master/release/release_logs).
## References
- The [pprof documentation](http://goog-perftools.sourceforge.net/doc/cpu_profiler.html).
- A [Go version of pprof](https://github.com/google/pprof).
- The [gperftools](https://github.com/gperftools/gperftools), including libprofiler, tcmalloc, and other useful tools.