 wehub-resource-sync
12 KiB

MLflow TypeScript SDK
MLflow TypeScript SDK




MLflow Typescript SDK is a variant of the MLflow Python SDK that provides a TypeScript API for MLflow.
Important
MLflow Typescript SDK is catching up with the Python SDK. Currently only support Tracing and Feedback Collection features. Please raise an issue in Github if you need a feature that is not supported.
Packages
| Package | NPM | Description |
|---|---|---|
| @mlflow/core |  |
The core tracing functionality and manual instrumentation. |
| @mlflow/openai |  |
Auto-instrumentation integration for OpenAI. |
Installation
npm install @mlflow/core
Note
MLflow Typescript SDK requires Node.js 20 or higher.
Quickstart
Start MLflow Tracking Server if you don't have one already:
pip install mlflow
mlflow server --backend-store-uri sqlite:///mlruns.db --port 5000
Self-hosting MLflow server requires Python 3.10 or higher. If you don't have one, you can also use managed MLflow service for free to get started quickly.
Instantiate MLflow SDK in your application:
import * as mlflow from '@mlflow/core';

mlflow.init({
  trackingUri: 'http://localhost:5000',
  experimentId: '<experiment-id>',
});
Configure with environment variables
The SDK can also read configuration from environment variables so you can avoid
hard-coding connection details. If MLFLOW_TRACKING_URI and
MLFLOW_EXPERIMENT_ID are set, you can initialize the client without passing
any arguments:
export MLFLOW_TRACKING_URI=http://localhost:5000
export MLFLOW_EXPERIMENT_ID=123456789
import * as mlflow from '@mlflow/core';

mlflow.init(); // Uses the values from the environment
Authentication
For MLflow tracking servers that require authentication, the SDK supports:
- Basic Auth (username/password):
mlflow.init({
  trackingUri: 'http://localhost:5000',
  experimentId: '123456789',
  trackingServerUsername: 'user',
  trackingServerPassword: 'pass',
});
Or via environment variables:
export MLFLOW_TRACKING_USERNAME=user
export MLFLOW_TRACKING_PASSWORD=pass
- Bearer Token:
mlflow.init({
  trackingUri: 'http://localhost:5000',
  experimentId: '123456789',
  trackingServerToken: 'my-token',
});
Or via environment variable:
export MLFLOW_TRACKING_TOKEN=my-token
- No authentication (default for local development)
Create a trace:
// Wrap a function with mlflow.trace to generate a span when the function is called.
// MLflow will automatically record the function name, arguments, return value,
// latency, and exception information to the span.
const getWeather = mlflow.trace(
  (city: string) => {
    return `The weather in ${city} is sunny`;
  },
  // Pass options to set span name. See https://mlflow.org/docs/latest/genai/tracing/quickstart
  // for the full list of options.
  { name: 'get-weather' },
);
getWeather('San Francisco');

// Alternatively, start and end span manually
const span = mlflow.startSpan({ name: 'my-span' });
span.end();
Tag spans with a severity level so users (or you) can filter by Minimum log level in the trace UI:
import { SpanLogLevel } from '@mlflow/core';

const tracedAnswer = mlflow.trace((query: string) => llm.generate(query), {
  name: 'answer',
  spanType: mlflow.SpanType.CHAT_MODEL,
  logLevel: SpanLogLevel.INFO,
});

// The string form works too:
mlflow.startSpan({ name: 'plumbing', logLevel: 'DEBUG' });
When you use one of the autolog integrations (@mlflow/openai, @mlflow/anthropic, @mlflow/gemini, etc.), MLflow stamps a sensible default level on every span based on its type — you don't need to annotate manually.
View traces in MLflow UI:

Publishing
- Run
yarn bump-version --version <new_version>from this directory to bump the package versions appropriately cdintocoreand runnpm publish, and repeat forintegrations/openai
Adding New Integrations
The TypeScript SDK supports pluggable auto-instrumentation packages under integrations/. To add a new integration:
- Create a new workspace package (for example,
integrations/<provider>), modeled after the OpenAI integration. - Implement the instrumentation entry points in
src/, exporting aregister()helper that configures tracing for the target client library. - Add package metadata (
package.json,tsconfig.json, and optionalREADME.md) so the integration can be built and published. - Add unit and/or integration tests under
tests/that exercise the new instrumentation. - Update the root
package.jsonbuild:integrationsandtest:integrationsscripts if your package requires additional build or test commands.
Once your integration package is ready, run the local workflow outlined in Running the SDK after changes and open a pull request that describes the new provider support.
Contributing
We welcome contributions of new features, bug fixes, and documentation improvements. To contribute:
- Review the project-wide contribution guidelines and follow the MLflow Code of Conduct.
- Discuss larger proposals in a GitHub issue or the MLflow community channels before investing significant effort.
- Fork the repository (or use a feature branch) and make your changes with clear, well-structured commits.
- Ensure your code includes tests and documentation updates where appropriate.
- Submit a pull request that summarizes the motivation, implementation details, and validation steps. The MLflow team will review and provide feedback.
Running the SDK after Changes
The TypeScript workspace uses npm workspaces. After modifying the core SDK or any integration:
npm install        # Install or update workspace dependencies
npm run build      # Build the core package and all integrations
npm run test       # Execute the test suites for the core SDK and integrations
You can run package-specific scripts from their respective directories (for example, cd core && npm run test) when iterating on a particular feature. Remember to rebuild before consuming the SDK from another project so that the latest TypeScript output is emitted to dist/.
Trace Usage
MLflow Tracing empowers you throughout the end-to-end lifecycle of your application. Here's how it helps you at each step of the workflow, click on each section to learn more:
🔍 Build & Debug
Smooth Debugging ExperienceMLflow's tracing capabilities provide deep insights into what happens beneath the abstractions of your application, helping you precisely identify where issues occur. |
|

💬 Human Feedback
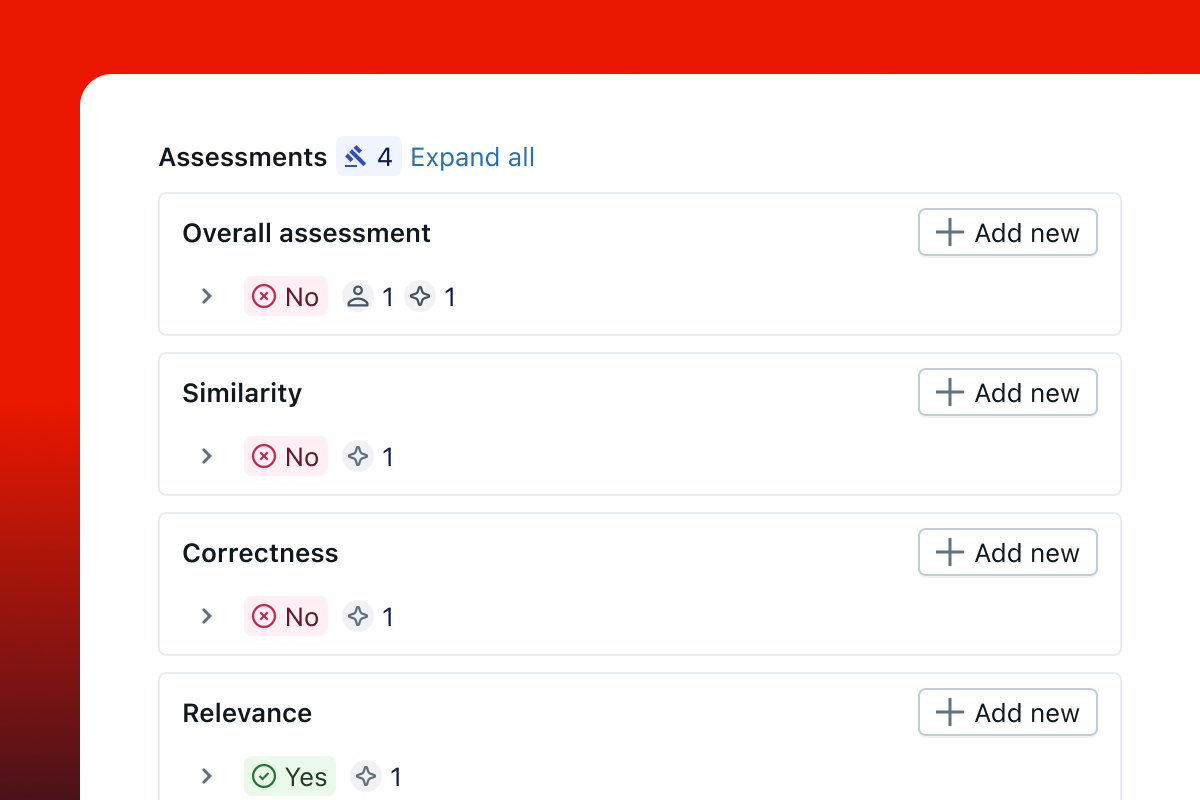
Track Annotation and User Feedback Attached to TracesCollecting and managing feedback is essential for improving your application. MLflow Tracing allows you to attach user feedback and annotations directly to traces, creating a rich dataset for analysis. This feedback data helps you understand user satisfaction, identify areas for improvement, and build better evaluation datasets based on real user interactions. |
|
📊 Evaluation
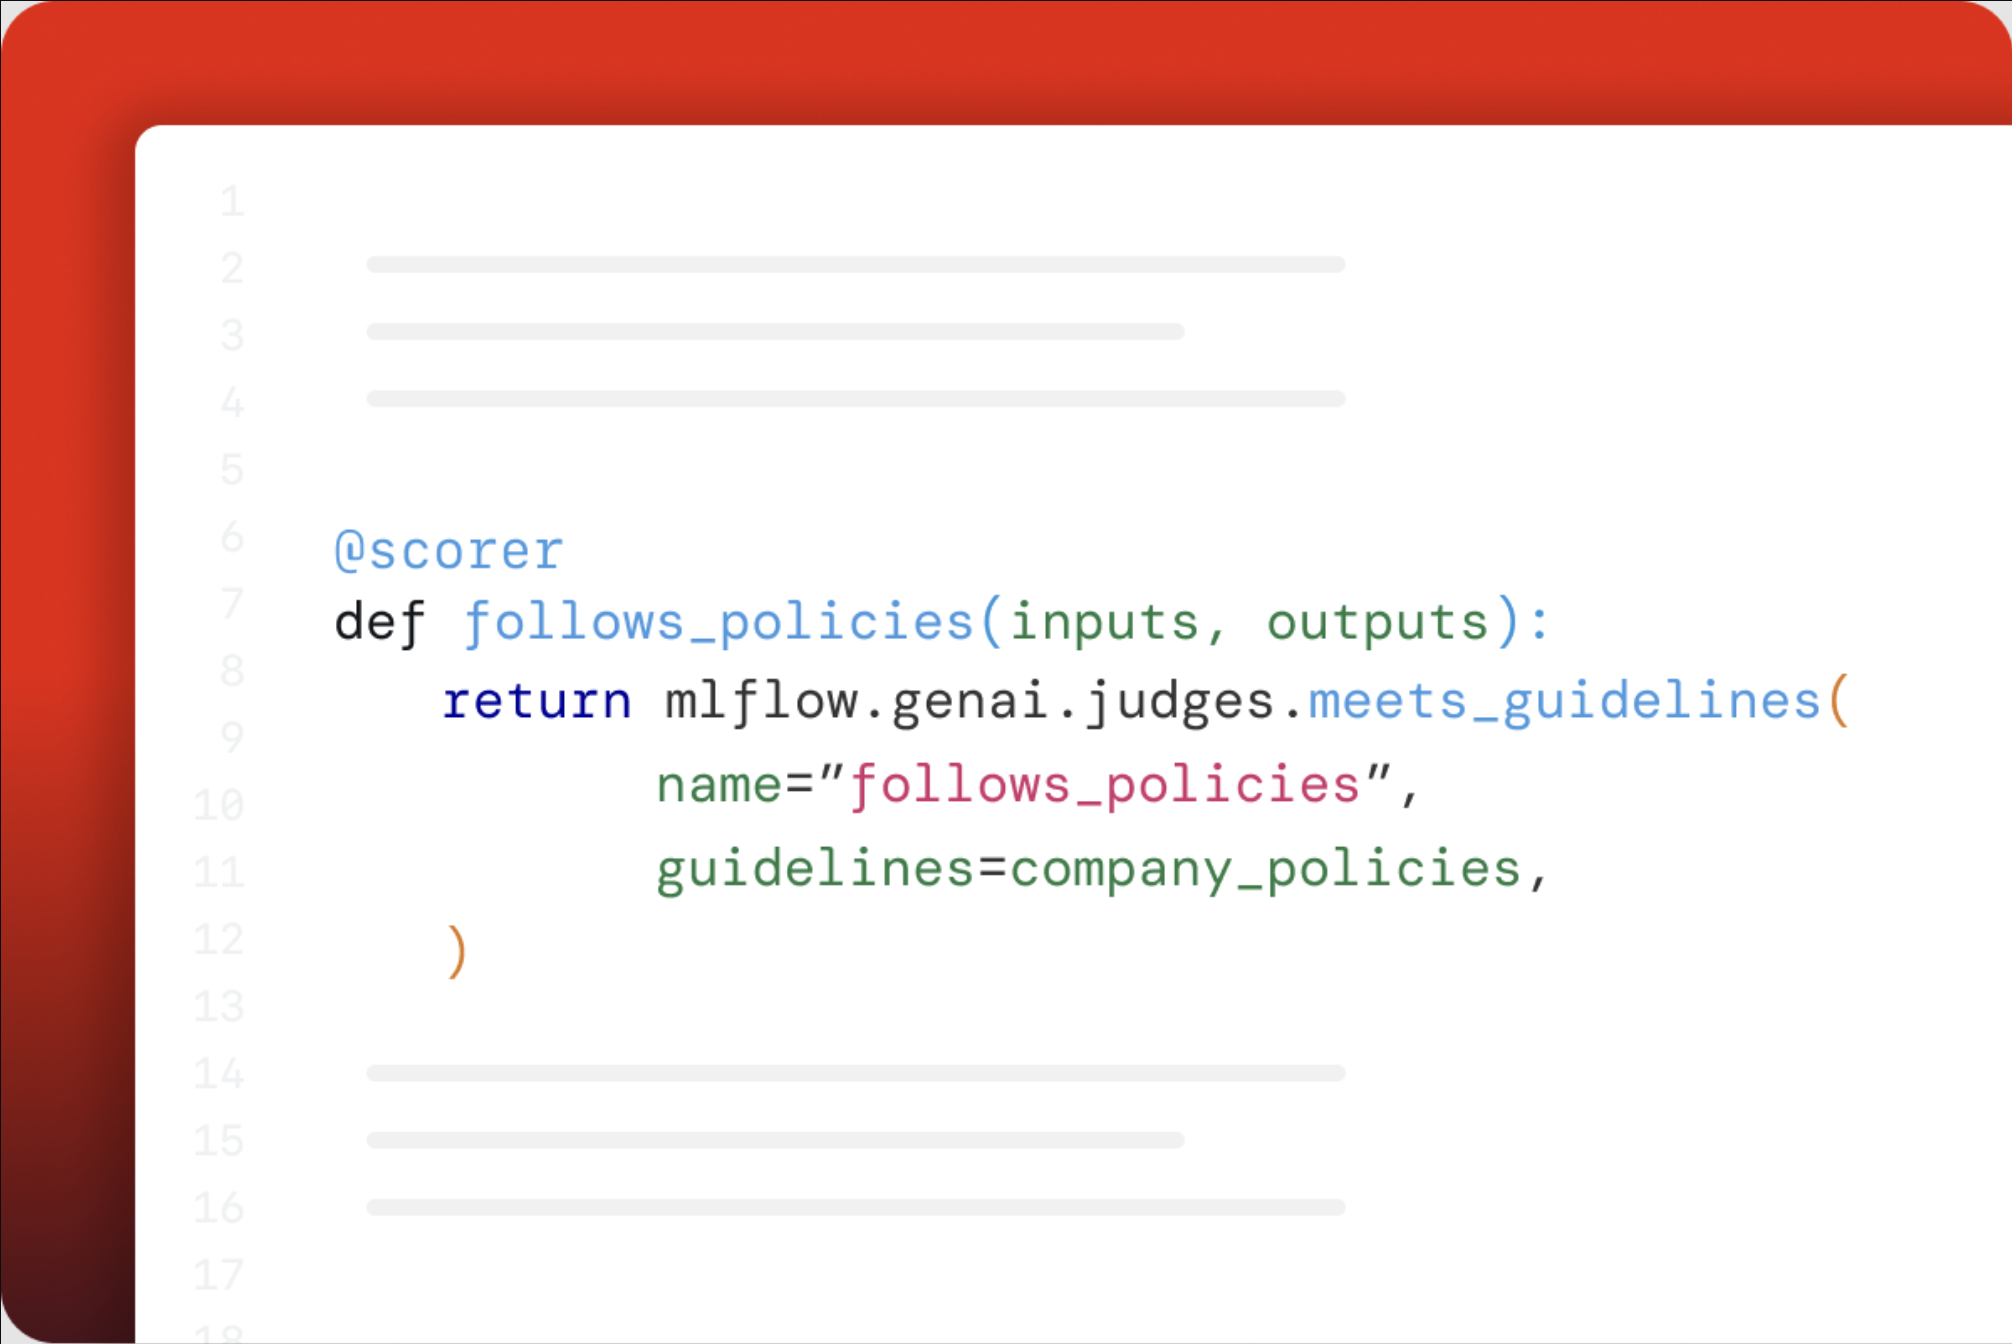
Systematic Quality Assessment Throughout Your ApplicationEvaluating the performance of your application is crucial, but creating a reliable evaluation process can be challenging. Traces serve as a rich data source, helping you assess quality with precise metrics for all components. When combined with MLflow's evaluation capabilities, you get a seamless experience for assessing and improving your application's performance. |
|
🚀 Production Monitoring
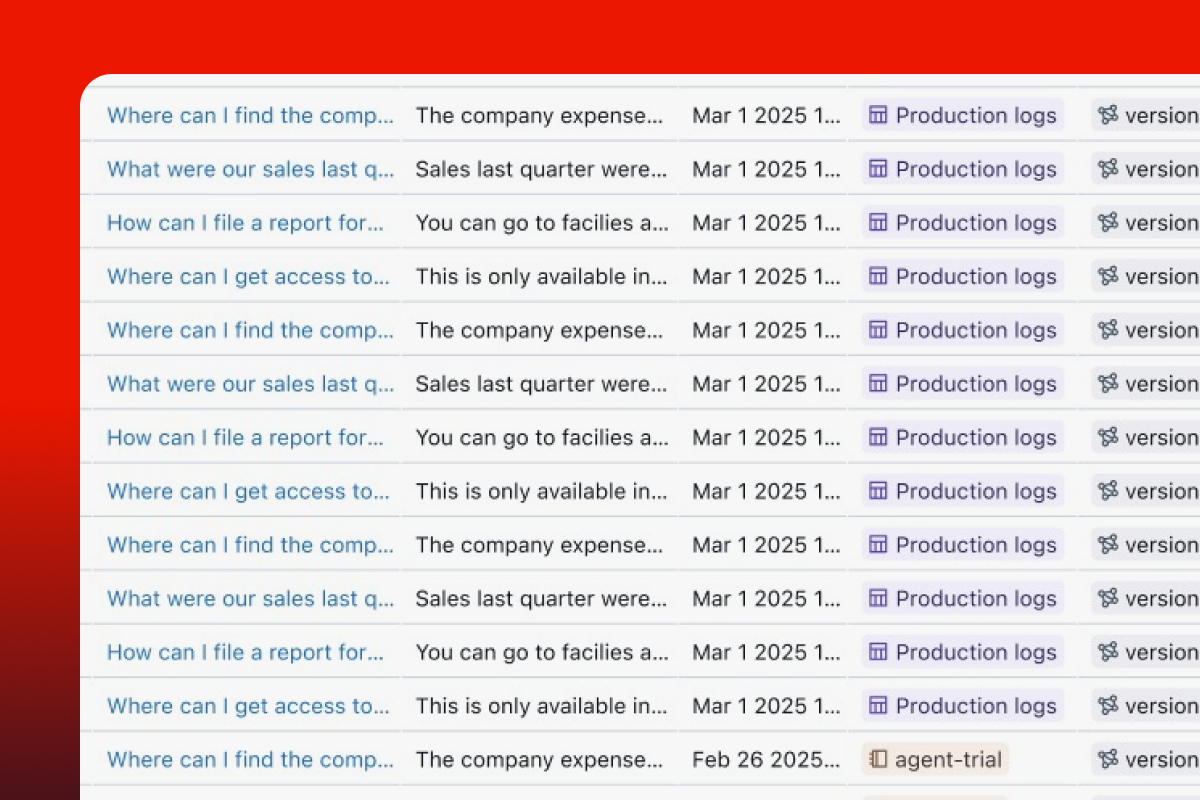
Monitor Applications with Your Favorite Observability StackMachine learning projects don't end with the first launch. Continuous monitoring and incremental improvement are critical to long-term success. Integrated with various observability platforms such as Databricks, Datadog, Grafana, and Prometheus, MLflow Tracing provides a comprehensive solution for monitoring your applications in production. |
|

📦 Dataset Collection
Create High-Quality Evaluation Datasets from Production TracesTraces from production are invaluable for building comprehensive evaluation datasets. By capturing real user interactions and their outcomes, you can create test cases that truly represent your application's usage patterns. This comprehensive data capture enables you to create realistic test scenarios, validate model performance on actual usage patterns, and continuously improve your evaluation datasets. |
|
Documentation 📘
Official documentation for MLflow Typescript SDK can be found here.
License
This project is licensed under the Apache License 2.0.