 wehub-resource-sync
 React Scan
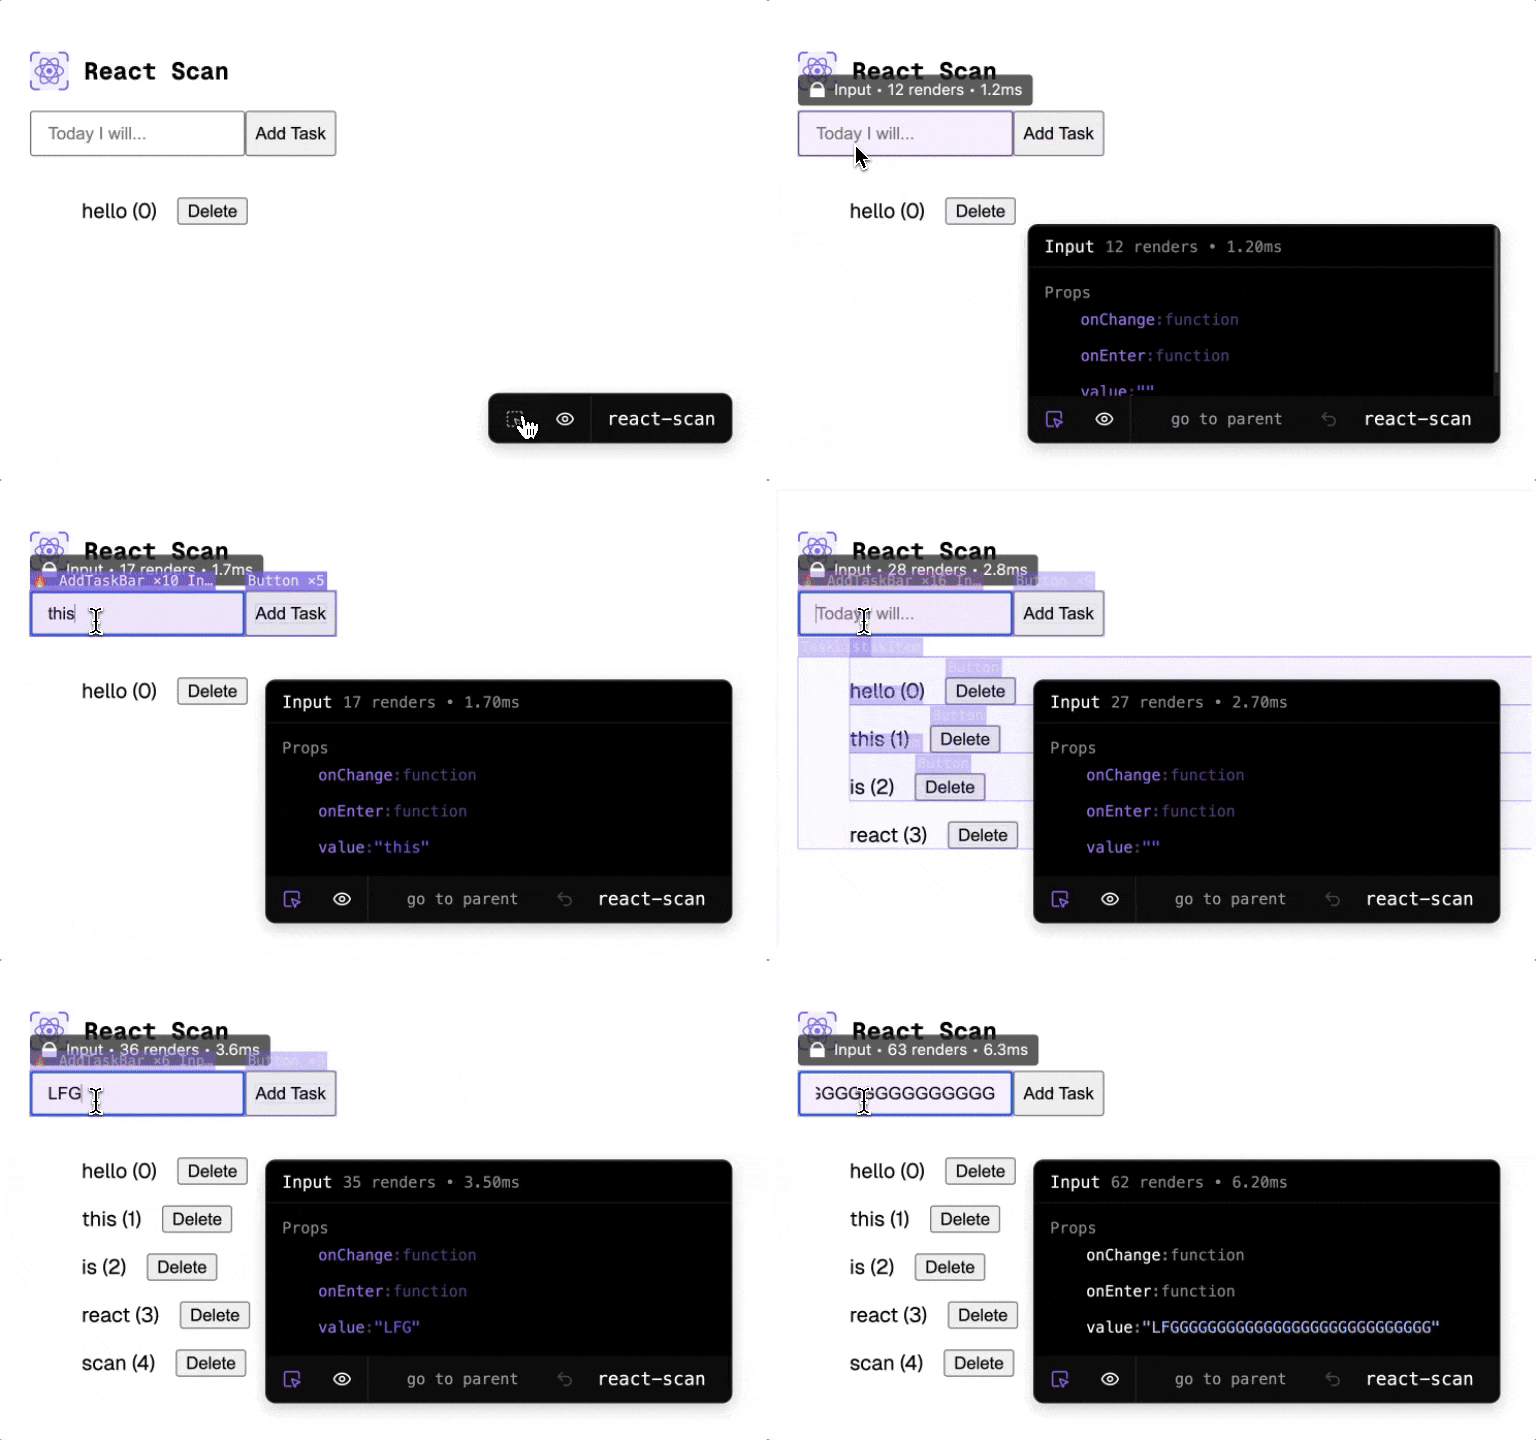
React Scan automatically detects performance issues in your React app.
Previously, tools like:
<Profiler />required lots of manual changes- Why Did You Render? lacked simple visual cues
- React Devtools didn't have a simple, portable, and programmatic API
React Scan attempts to solve these problems:
- It requires no code changes – just drop it in
- It highlights exactly the components you need to optimize
- Use it via script tag, npm, CLI, you name it!
Trusted by engineering teams at:
Airbnb 


Try it out! →
Install
Package managers
npm i react-scan
pnpm add react-scan
yarn add react-scan
CDN
<!-- import this BEFORE any scripts -->
<script src="https://unpkg.com/react-scan/dist/auto.global.js"></script>
Usage
- NextJS App Router
- NextJS Page Router
- Create React App
- Vite
- Parcel
- Remix
- React Router
- Astro
- TanStack Start
CLI
If you don't have a local version of the site or you want to test a React app remotely, you can use the CLI. This will spin up an isolated browser instance which you can interact or use React Scan with.
npx react-scan@latest http://localhost:3000
# you can technically scan ANY website on the web:
# npx react-scan@latest https://react.dev
You can add it to your existing dev process as well. Here's an example for Next.js:
{
  "scripts": {
    "dev": "next dev",
    "scan": "next dev & npx react-scan@latest localhost:3000"
  }
}
Browser Extension
If you want to install the extension, follow the guide here.
React Native
See discussion
react-scan/lite: headless instrumentation
A tiny, UI-less entry point that taps into the same React DevTools profiling channel the Timeline Profiler uses. No toolbar, no canvas, no styles. Just a stream of commit / render / state-update events you can pipe to a callback or POST to an endpoint. Pairs naturally with a long-animation-frame PerformanceObserver so you can attribute a slow LoAF to a specific component subtree.
import { instrument } from "react-scan/lite";

const handle = instrument({
  onEvent: (event) => console.log(event),

  // optional: POST every event to an ingest endpoint
  endpoint: "http://127.0.0.1:54321/ingest/abc123",
  sessionId: "abc123",

  // optional: enrich each fiber summary
  recordChangeDescriptions: true, // why did this re-render? (props/state/context/hooks/parent)
  includeFiberSource: true,       // file:line of each fiber's JSX call site
  includeFiberIdentity: true,     // stable id across commits, for cascade histograms
});

handle.subscribe((event) => {
  if (event.kind === "commit") {
    // event.tree[] = per-fiber { name, fiberId, depth, actualDuration,
    //                            source, ownerName, changeDescription }
    // event.priorityName = "UserBlocking" | "Normal" | ...
  }
  if (event.kind === "profiling-hooks-status" && !event.available) {
    // React 19.2+ prod or non-__PROFILE__ build: mark* hooks won't fire.
    // Fall back to LoAF-only attribution.
  }
});

handle.stop(); // idempotent
instrument must run before react-dom mounts (top of your entry, or as the first script in <head>). It's SSR-safe: calling instrument() in Node returns a noop handle whose isActive() is false.
Per-fiber enrichment
| Option | Default | What you get |
|---|---|---|
recordChangeDescriptions |
false |
changeDescription: { isFirstMount, props[], state, context, hooks[], parent } per fiber. Answers "why this re-rendered" in a single event. |
includeFiberSource |
false |
source: { fileName, lineNumber, columnNumber } + ownerName, read from _debugSource (R16/17/18) or _debugStack (R19+). Sync, no symbolication. |
includeFiberIdentity |
false |
fiberId: number, stable monotonic id per logical fiber (alternate-aware), so the agent can build cross-commit histograms. |
includeLaneLabels |
true |
laneLabels: string[] (translated via renderer.getLaneLabelMap()) and priorityName (e.g. "UserBlocking") |
maxFibersPerCommit |
5000 |
Cap on tree size per commit to bound payload size |
minFiberActualDurationMs |
0 |
Skip fibers below this threshold |
Build profile
actualDuration and the mark* profiling hooks only populate in __PROFILE__ builds. In development that's the default; in production you can opt in by aliasing react-dom to react-dom/profiling in your bundler (resolve.alias in webpack/vite). Otherwise onCommitFiberRoot still fires but every fiber's actualDuration is 0. The profiling-hooks-status event makes this explicit: available: false with reason: "no-inject-method" means React 19.2+ in prod or a non-__PROFILE__ build, so the agent should fall back to LoAF-only attribution rather than concluding "idle".
Coexistence with React DevTools
If React DevTools is also attached, instrument() logs a one-time warning: the injectProfilingHooks channel is a hard replace, so DevTools' Timeline Profiler stops receiving events while this instrumentation is active. Call handle.stop() to restore.
API Reference
Options
export interface Options {
  /**
   * Enable/disable scanning
   *
   * Please use the recommended way:
   * enabled: process.env.NODE_ENV === 'development',
   *
   * @default true
   */
  enabled?: boolean;

  /**
   * Force React Scan to run in production (not recommended)
   *
   * @default false
   */
  dangerouslyForceRunInProduction?: boolean;
  /**
   * Log renders to the console
   *
   * WARNING: This can add significant overhead when the app re-renders frequently
   *
   * @default false
   */
  log?: boolean;

  /**
   * Show toolbar bar
   *
   * If you set this to true, and set {@link enabled} to false, the toolbar will still show, but scanning will be disabled.
   *
   * @default true
   */
  showToolbar?: boolean;

  /**
   * Animation speed
   *
   * @default "fast"
   */
  animationSpeed?: "slow" | "fast" | "off";

  /**
   * Track unnecessary renders, and mark their outlines gray when detected
   *
   * An unnecessary render is defined as the component re-rendering with no change to the component's
   * corresponding dom subtree
   *
   *  @default false
   *  @warning tracking unnecessary renders can add meaningful overhead to react-scan
   */
  trackUnnecessaryRenders?: boolean;

  onCommitStart?: () => void;
  onRender?: (fiber: Fiber, renders: Array<Render>) => void;
  onCommitFinish?: () => void;
  onPaintStart?: (outlines: Array<Outline>) => void;
  onPaintFinish?: (outlines: Array<Outline>) => void;
}
scan(options: Options): Imperative API to start scanninguseScan(options: Options): Hook API to start scanninggetReport(): Get a report of all the renderssetOptions(options: Options): void: Set options at runtimegetOptions(): Get the current optionsonRender(Component, onRender: (fiber: Fiber, render: Render) => void): Hook into a specific component's renders
Why React Scan?
React can be tricky to optimize.
The issue is that component props are compared by reference, not value. This is intentional – this way rendering can be cheap to run.
However, this makes it easy to accidentally cause unnecessary renders, making the app slow. Even in production apps, with hundreds of engineers, can't fully optimize their apps (see GitHub, Twitter, and Instagram).
This often comes down to props that update in reference, like callbacks or object values. For example, the onClick function and style object are re-created on every render, causing ExpensiveComponent to slow down the app:
<ExpensiveComponent onClick={() => alert("hi")} style={{ color: "purple" }} />
React Scan helps you identify these issues by automatically detecting and highlighting renders that cause performance issues. Now, instead of guessing, you can see exactly which components you need to fix.
FAQ
Q: Why this instead of React Devtools?
React Devtools aims to be a general purpose tool for React. However, I deal with React performance issues every day, and React Devtools doesn't fix my problems well. There's a lot of noise (no obvious distinction between unnecessary and necessary renders), and there's no programmatic API. If it sounds like you have the same problems, then React Scan may be a better choice.
Also, some personal complaints about React Devtools' highlight feature:
- React Devtools "batches" paints, so if a component renders too fast, it will lag behind and only show 1 every second or so
- When you scroll/resize the boxes don't update position
- No count of how many renders there are
- I don't know what the bad/slow renders are without inspecting
- The menu is hidden away so it's annoying to turn on/off, user experience should be specifically tuned for debugging performance, instead of hidden behind a profiler/component tree
- No programmatic API
- It's stuck in a chrome extension, I want to run it anywhere on the web
- It looks subjectively ugly (lines look fuzzy, feels sluggish)
- I'm more ambitious with react-scan
Resources & Contributing Back
Want to try it out? Check the our demo.
Looking to contribute back? Check the Contributing Guide out.
Want to talk to the community? Hop in our Discord and share your ideas and what you've build with React Scan.
Find a bug? Head over to our issue tracker and we'll do our best to help. We love pull requests, too!
We expect all contributors to abide by the terms of our Code of Conduct.
→ Start contributing on GitHub
Acknowledgments
React Scan takes inspiration from the following projects:
- React Devtools for the initial idea of highlighting renders. We chose to diverge from this to provide a better developer experience
- Million Lint for scanning and linting approaches
- Why Did You Render? for the concept of hijacking internals to detect unnecessary renders caused by "unstable" props
License
React Scan is MIT-licensed open-source software by Aiden Bai, Million Software, Inc., and contributors.